Part 1
- 請問 index-color 和 truecolor 影像的矩陣大小有何關係式?為什麼?
Answer: truecolor 影像矩陣大小是 index-color 影像矩陣大小的3倍,因為前者使用了 R、G、B 三個原色來表示一個顏色,而後者只用一個數值來代表色盤矩陣的位置。 - 請寫一段程式 imageNegative01.m,讀入mandrill.mat 資料檔,將色盤矩陣設為 1-map 後,顯示此負片效果的狒狒影像,並將此影像存成一個 bmp 的檔案。
- 請寫一段程式 imageAdjustContrast01.m,讀入位於 clown.mat 內的小丑影像,顯示影像,並將 colormap 改成 gray,你會發覺小丑的影像偏暗,請調整色盤矩陣,使其明亮度提高。
- 請寫一段程式 imageThreshold01.m,讀入位於 mandrill.mat 的狒狒影像,想辦法調整 X 及 map,使得呈現的影像是由全黑或全白的像素所組成,而且其個數比例大約是1:1。
提示:使用 median 指令找出 X(:) 的中位數。 - 使用 index-color image 是為了要節省空間。假設我們使用的色盤矩陣含有 256 種顏色,並假設此影像的寬度為 16,請問當長度為多少以上,才能達到節省記憶體的效果?
Hint: $m \times n \times log_2(c)+c \times 3 \times 8 \leq m \times n \times 3 \times 8$, where $c=256$. - 假設 Y 為 index-color 影像的資料矩陣,map 為色盤矩陣,Y 的值為 1~K,當 Y(i,j) 的值為 p,則像素點 (i,j) 的顏色由下列何者決定?
- map(:, p)
- map(p, :)
- map(:, :)
- map(p, p)
- 下列哪一種影像格式不支援全彩(只有256色)?
- BMP
- JPG
- GIF
- PNG
- 一般 true-color image 可以支援 24 位元全彩,請問能利用 RGB 組出多少種色彩?請詳述計算過程。
Ans: R、G、B 各有 8 bit,所以共有 (2^8)*(2^8)*(2^8) = 2^24 種組合,所以 24 位元全彩能組出 2^24 種顏色。
Part 2
- Number of colors in an index-color image:
Given an index-color image "X" (assuming its indexing is 1-based) and it's color map "map", write a one-line MATLAB statement to compute the following quantities.
- Number of colors available for the image.
- Number of unique colors in the image.
Solution:
- size(map, 1)
- length(unique(X))
- Check if each color in the colormap is used:
Given an index-color image "X" (assuming its indexing is 1-based) and it's color map "map", write a one-line MATLAB command to test if each color in the color map is used in the image.
Solution:
isequal(unique(X)', 1:size(map,1)) - Convert an indexed image to a true-color one:
Given an index-color image "X" (assuming it's indexing is 1-based) and it's color map "map", write a scipt to convert it into a true-color image B.
Solution:
load clown.mat r=map(:,1); B(:, :, 1)=r(X); g=map(:,2); B(:, :, 2)=g(X); b=map(:,3); B(:, :, 3)=b(X); image(B); orload clown.mat r=map(:,1); g=map(:,2); b=map(:,3); B=cat(3, r(X), g(X), b(X)); image(B); - Convert an index-color RGB image to a grayscale one:
Given an index-color image "X" and it's color map "map",
Write two lines of MATLAB statements to convert the image to a grayscale intensity image, where the formula for conversion is:
grayScale = 0.21*R + 0.71*G + 0.08*B; Note that you are not allowed to use the MATLAB function "rgb2gray". - Image rotation:
Write a MATLAB script to read the following image, rotate it 90 degrees counter-clockwise, and save it to another image file with the same extension. What do you see in the rotated image?

Hint: You can use the command "rot90". - Image rotation:
Write a MATLAB script to read the following image, rotate it 90 degrees clockwise, and save it to another image file with the same extension. What do you see in the rotated image?

Hint: You can use the command "rot90". - Identify the formula for convert an RGB image to a grayscale one:
An RGB image and its grayscale version are shown below:


- Use the least-squares method to identify the coefficients ($\rho_R$, $\rho_G$, $\rho_B$) of the formula for converting an RGB image to a grayscale one: $$grayScale = \rho_R*R + \rho_G*G + \rho_B*B;$$
- Plot the histogram of the errors (defined as the difference between the desired grayscale image and the reconstructed one ). Be sure to have enough number of bins (say, more than 100) to show more details of the histogram.
- Difference in the variables returned by 'imfinfo':
We can check the variables returned by 'imfinfo' by issuing the following commands (using the image files in the previous exercise):
info1=imfinfo('annie19980405.jpg'); info2=imfinfo('annie19980405Gray.jpg'); What are the different field values in 'info1' and 'info2'? - Resize an image to its 1/4:
Given a true-color image of size mxnx3, write a script to resize it into an image of size (m/2)x(n/2)x3.
Solution:
I=imread('annie19980405.jpg'); I2=double(I); I3=(I2(1:2:end, :, :)+I2(2:2:end, :, :))/2; I4=(I3(:, 1:2:end, :)+I3(:, 2:2:end, :))/2; image(uint8(round(I4))); fprintf('Size of I is %s\n', mat2str(size(I))); fprintf('Size of I4 is %s\n', mat2str(size(I4))); - Display two indexed images on the same windows:
Write a script to read two indexed images and display them on the same MATLAB figure window? Here are two indexed images for your script:
 and
and  . The result should be similar to the following plot:
What if the total number of colors is more than 256? Can MATLAB still display both images correctly? Please use this image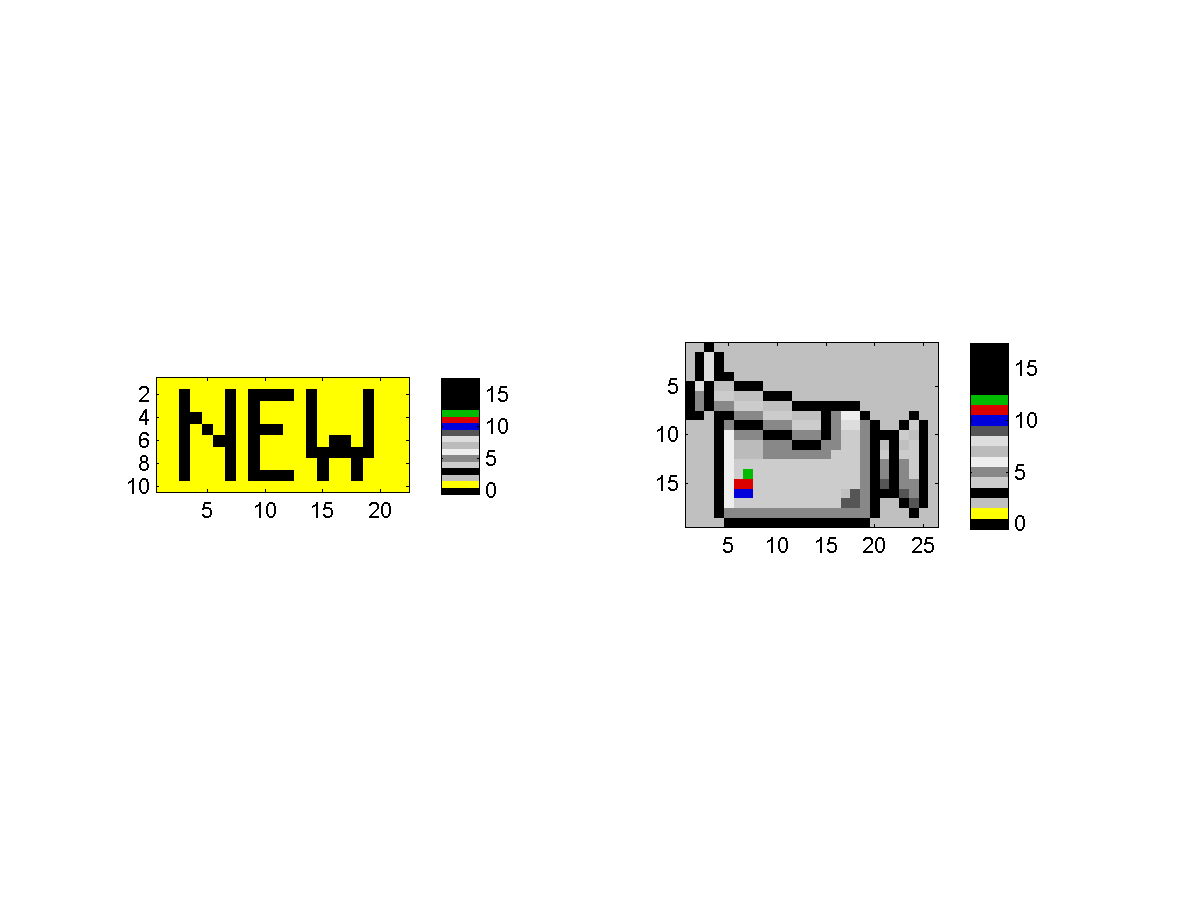
 (which has 256 colors) together with any indexed image for your test.
- Overlay two indexed images:
A straight way to overlay two indexed images is describe as follows:
- If the original images are indexed-color, convert them into true-color.
- Take the average of both images.
- Convert the true-color image back to index image, where you need to use data clustering to find the best colormap.
 and
.
Please display the overlayed image to TA. (Save it as a gif file if your machine has Image Processing Toolbox.)
and
.
Please display the overlayed image to TA. (Save it as a gif file if your machine has Image Processing Toolbox.)
MATLAB程式設計:入門篇
